The built-in Desmos graphing calculator is a game changer for the math section of the digital SAT. It allows you to visualize equations, find instant solutions, and reduce human error on calculations.
In this guide, we'll cover features, hacks and strategies for using Desmos to help boost your SAT score. For an overview of the math section structure and other strategies, see our SAT math guide.
Familiarizing yourself with the Desmos interface
Before we dive into specific features, let's get comfortable with the basic layout. When you open Desmoson the SAT (or in the Bluebook app), you'll see a clean, intuitive interface:
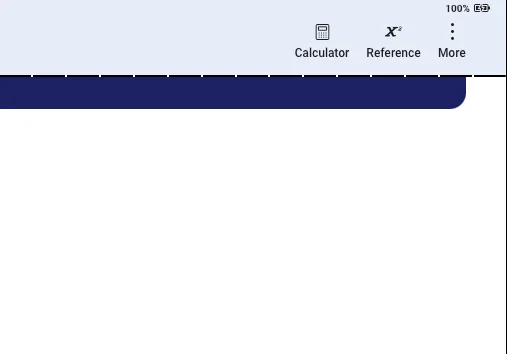
Accessing the tool
To open the calculator, simply click the calculator icon at the top of the testing screen.
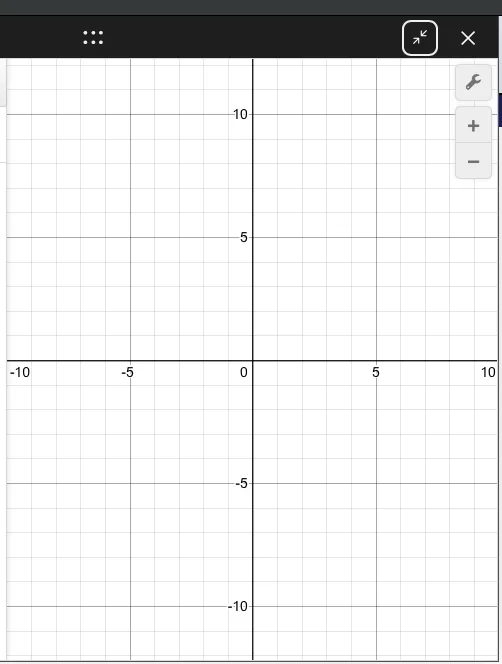
Graphing area (main screen)
This is where all your graphs, points, and visuals will appear. It's your canvas!
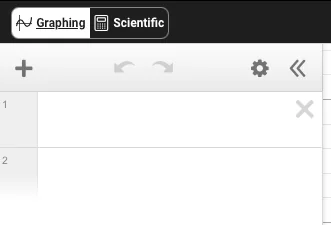
Expression list (left side)
This is where you'll type in equations, functions, points, and commands. Each line (or "expression") can hold a different input.
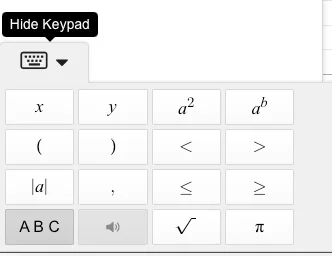
Keyboard icon
In the bottom left, you'll find an icon that brings up the Desmos on-screen keyboard. This is essential for accessing functions, symbols, and operators.
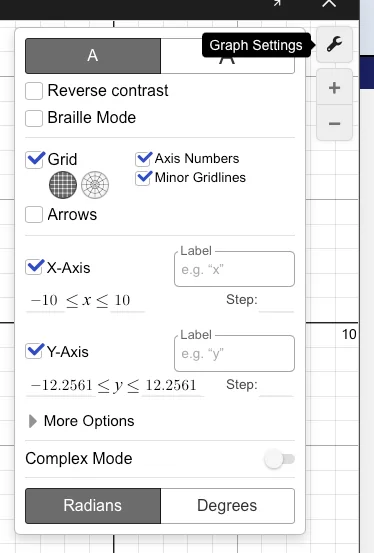
Settings wrench icon
Located in the top right, this allows you to adjust graph settings.
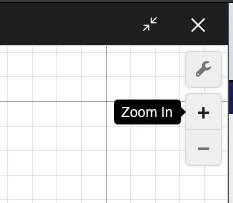
Zoom controls
Use the plus and minus buttons in the upper right to adjust your view.
Spend a few minutes practicing typing a simple equation like during your study sessions to become comfortable with the software before test day.
When to use Desmos
1. Visualizing equations and intercepts
Desmos's primary strength is its ability to turn abstract equations into clear visuals.
- How to do it: Type any equation directly into an expression line. You can graph multiple functions simultaneously, and they will appear in different colors for easy comparison.
- Why it's useful: Desmos automatically highlights key coordinates such as x-intercepts, y-intercepts, and vertices. Clicking on these “grey points” reveals their exact values, which is often the direct answer to an SAT question.
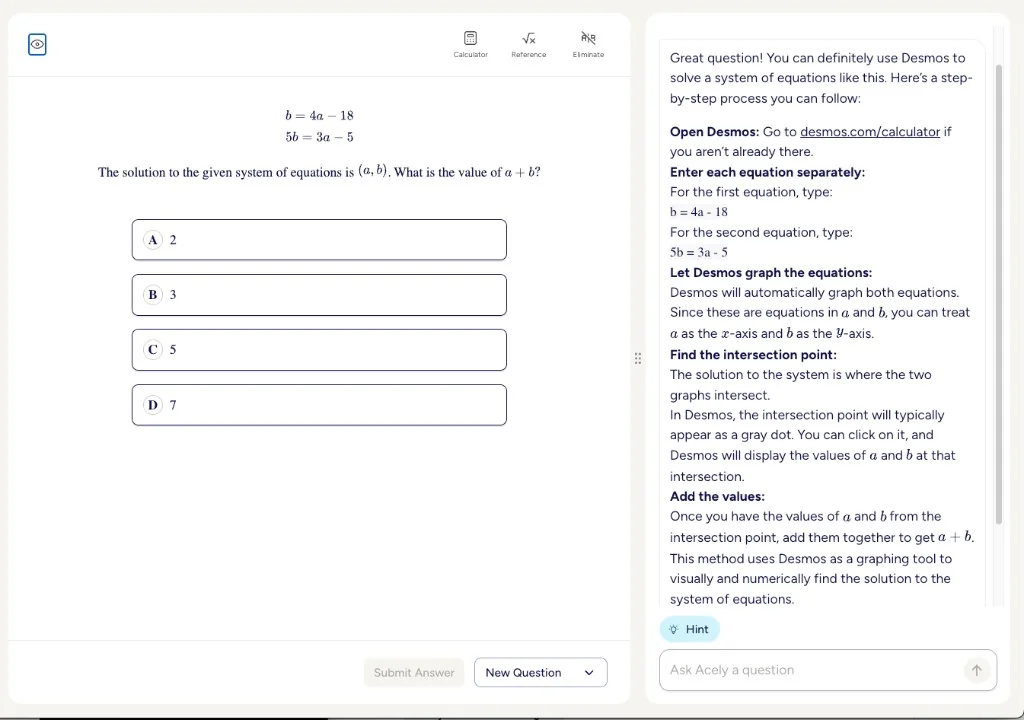
2. Solving equations and systems of equations
One of the fastest ways to use Desmos is for solving systems of linear or non-linear equations.
- Single Equation Hack: If you are given a single equation like , you can solve it by splitting the equation into two separate lines. Graph the left side as and the right side as . The x-coordinate of their intersection is your solution.
- Systems of Equations: Enter each equation on its own line. The intersection point of the lines represents the solution to the system. This should be your go-to strategy for solving these problems.
Step-by-step guide: how to solve a system of equations in Desmos
- Open Desmos. Click the calculator icon in the top bar of the math section so the graphing calculator appears.
- Enter the first equation. On line 1, type the first equation in y-form (e.g., ). Press Enter.
- Enter the second equation. On line 2, type the second equation (e.g., ). Both lines will plot on the graph.
- Find the intersection. Click the point where the two lines cross. Desmos will display the exact coordinates—that’s your solution.
3. Data tables and regressions
When you are given a table of values or a set of points and asked for an equation, Desmos can reverse-engineer the answer.
- Using Tables for Visualization: Type “table” or use the plus icon to create a table. Enter your data into the and columns to see the points plotted on the graph. This helps in identifying trends or checking if a multiple-choice answer fits the given data.
- Regression (The Tilde Trick): To find a specific equation that fits your data, type a general form using a tilde (~) instead of an equal sign. For a linear model, type ~ . Desmos will instantly calculate the values for and that fit the points in your table.
4. Sliders for unknown constants
A slider allows you to dynamically change the value of a variable and see its effect in real-time.
- How to use them: If you type an equation with an unknown constant like , Desmos will create a slider for “k”.
- Why it's useful: You can adjust the slider until the graph meets the specific conditions you seek, such as passing through a required point.
5. Statistics and Mathematical Shortcuts
Desmos is also a fully functional scientific calculator!
- Statistical Functions: You can find the mean, median, or standard deviation of a list of numbers by using the “functions” tab and selecting the statistical section.
- Keyboard Shortcuts: Use these to save time during the exam: Exponent: Shift + 6. Square Root: Type “sqrt”. Cube Root: Type “cbrt”. Pi: Type “pi”. Fractions: Type “frac” to create a template.
When not to use Desmos
For simple arithmetic or straightforward algebra (e.g., solving or multiplying fractions), mental math or a quick pencil scratch is often faster than opening Desmos and typing. Use Desmos when it saves time (graphing, systems of equations, regressions, and checking work) not for every single calculation.
Strategic hacks for specific math domains
| Math domain | Strategic Desmos move |
|---|---|
| Algebra | Inequalities: Graph inequalities to see shaded solution regions. For a system, the solutions are where the shaded regions overlap. |
| Algebra/Advanced Math | Evaluating Functions: Define your function as . Then, type to find the output value when instantly. |
| Algebra/Advanced Math | Function Translations: Graph your original function , then graph to see how shifting and moves the graph. |
| Advanced Math | Equivalent Expressions: To check if two expressions are the same, graph them both. If the lines overlap exactly, you have found the correct answer. |
| Advanced Math | Quadratics: Find the vertex (peak or valley) or intercepts of a parabola by clicking the highlighted grey dots on the graph. |
| Advanced Math | Domain Restrictions: Add squiggly brackets like {x > 0} after an equation to restrict the graph to a specific interval. |
| Geometry | Circle Equations: Type the full circle equation (e.g., ) to find the center and radius visually without manual algebra. |
| Geometry | Distance Formula: Use the distance(A, B) function where A and B are defined points to find the length between them. |
| Problem Solving | Data Summaries: Use the keywords mean(list) and median(list) to get statistical data quickly. |
| Problem Solving | Percentage Calculations: Calculate percentages by typing them as decimals (e.g., 0.15 * 80). |
Practical tips for test day
- Confirm Your Units: Trigonometry questions may require either degrees or radians. Use the wrench icon to verify your setting matches the question requirements.
- Zoom Fit: If you enter an equation and cannot see the graph, use the plus and minus buttons or your touchpad to adjust the view until your lines appear.
- Shortcut Symbols: Quickly type inequalities using symbols like <= for ≤ to save precious seconds.
- Vertex and Roots: For any quadratic, your first instinct should be to graph it. The x-intercepts are your solutions, and the peak or valley is your vertex.
Knowing how to use Desmos is half the battle. The other half is knowing when it is the most efficient choice. While Desmos is incredibly powerful, it should complement your conceptual understanding to help you pick up quick points and avoid careless mistakes.
Bluebook practice
The digital SAT is administered in Bluebook, the official College Board app. Download Bluebook and take a full-length practice test or module before test day so you’re comfortable with the exact Desmos interface you’ll see on the real exam.
More resources
With Incublia, you can not only practice using Desmos live on a practice test or practice question, but the math explanations also include screenshots of how you could solve a given problem with Desmos. You can also ask Incublia's AI tutor how you could have used Desmos for a problem, and it will give you the steps needed. It's the perfect way to start understanding when to use it and build the confidence you need for test day.
Incublia also has an entire SAT Math book on using Desmos available on the platform. For more on test architecture, content domains, and strategies like backsolving, check out our SAT math guide.
For step-by-step walkthroughs on how to use Desmos for specific SAT math problems, see our Desmos Guide Library.
If you're looking for helpful videos, Rishab and LearnSATMath have great videos walking through Desmos in real time.